Treasury Bonds: Riding the Range

Last year's volatility in the fixed income markets has carried into the new year. Ten-year Treasury yields remain elevated after surging by about 100 basis points (or 1.0%) since September 2024. There have been many drivers behind the rise in yields. Economic growth has been stronger than expected, inflation's decline has slowed, and there are indications that U.S. government fiscal policy changes could boost inflation and deficits.
10-year Treasury yields have risen sharply since September 2024
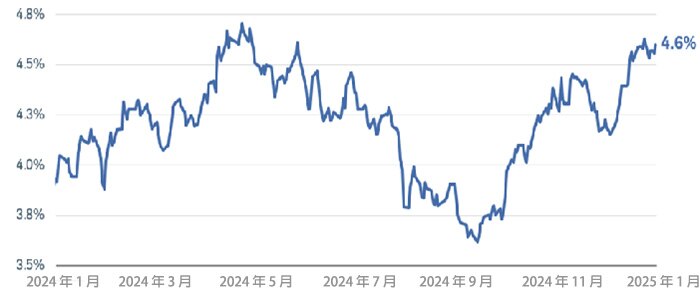
資料來源:Bloomberg。美國 10 年期一般國債收益率 (USGG10YR 指數)。截至 2025 年 1月 3 日的每日數據。
過往表現不保證將來結果。
The upshot is that there is a wide range of potential outcomes for the bond market in 2025. At this juncture, we see Treasury yields near our estimates of fair value. However, we suggest investors stick close to their benchmark durations and stay up in credit quality, rather than take a lot of interest rate or credit risk, given the high level of uncertainty around policy.
Nonetheless, we see opportunities on the horizon. Bond yields are likely to trade in a wide range as the markets sort through the impact of these various factors. Navigating through the volatility can mean capturing higher nominal and real yields for portfolios longer term. Maintaining some flexibility to act when yields move to the upper end of the expected range can prove beneficial.
Treasuries look fairly priced
The key driver behind Treasury yields is the Federal Reserve. Expectations about the future path of the federal funds rate tend to have the highest correlation with intermediate- and long-term Treasury yields of the factors that we monitor. In turn, those expectations have shifted to reflect how the market views the way the Fed will address growth and inflation.
At the December Federal Reserve Open Market Committee (FOMC) meeting, policymakers cut the federal funds rate (the rate banks charge each other for overnight loans) by 25 basis points, or 0.25%, to a range of 4.25% to 4.5%. At the same time, the Fed's median projections for the future path of the federal funds rate shifted significantly compared to the September FOMC meeting. The FOMC's "dot plot" projection now suggests only two rate cuts of 25 basis points each in 2025 and a longer-run rate of 3.0%.
The Fed's most recent dot plot suggests two rate cuts in 2025

資料來源:彭博社和美聯儲,截至 2024 年 12 月 18 日。
每個點代表美聯儲決策者對所示每年年底利率目標範圍的看法。
Market pricing is aligned with the Fed's view for this year but sees the fed funds rate stabilizing in the 3.75% to 4% area. Based on these projections, yields for intermediate- and long-term Treasuries appear reasonable at current levels. Over the past 50 years, the average spread between 10-year Treasury yields and the federal funds rate has been around 120 basis points, but the range has been wide. Nonetheless, since the end of the global financial crisis in 2010, the most frequent readings in the spread have been in the 125- to 150-basis-point range. Consequently, it suggests that a current 10-year Treasury yield near 4.5% would be consistent with the long-term trends, although market expectations suggest yields could move higher.

資料來源:Bloomberg。
聯邦基金目標利率 - 上限(FDTR 指數)和美國 Generic Govt 10 年期債券利率(USGG10YR 指數)。使用從 1990 年 1 月 1 日到 2025 年 1 月 3 日的每週數據。圖表僅包括聯邦基金利率為 1% 或更高的時期。過往表現不保證未來結果。
2025: Keeping it real
Another factor suggesting yields are fairly priced or even a bit high is the level of real or inflation-adjusted yields. Using the Treasury Inflation Protected Securities (TIPS) market, real yields are in the 2.25% to 2.5% region—above the Fed's 2% inflation target. Those are the highest yields in more than 15 years. That means an investor who buys and holds a TIPS to maturity would get a yield of 2.25% to 2.5% in addition to the nominal inflation rate over the life of that TIPS.
Real yields are above the Fed's 2% inflation target

資料來源:彭博社,截至 2025 年 1 月 24 日。
US Generic Govt TII 5 Yr (USGGT5Y 指數), US Generic Govt TII 10 Yr (USGGT10Y 指數)。
指數不受管理,不產生管理費、成本和開支,也不能直接投資。過往表現不保證未來結果。
A third factor supporting current valuations is the declining trend in global bond yields. Due to the relative strength of the U.S. economy, the level of U.S. rates is high compared to other countries and the value of the U.S. dollar is very strong. Those trends appear likely to continue, which should underpin demand for U.S. Treasuries in the global market.
U.S. interest rates are high compared to those in other countries
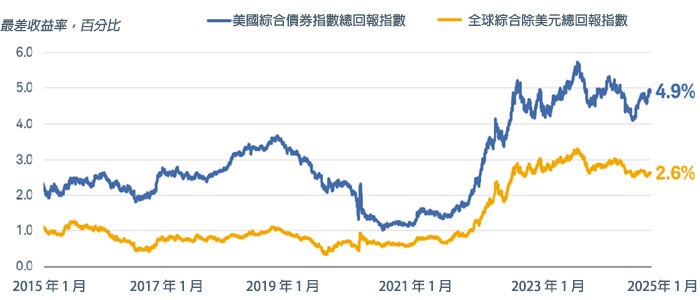
資料來源:Bloomberg。
彭博美國綜合債券指數總回報指數(LBUSTRUU 指數)和彭博全球綜合除美元總回報指數(LG38TRUU 指數)。截至 2025 年 1 月 3 日的每日數據。
指數不受管理,不產生管理費、成本和開支,也不能直接投資。過往表現不保證未來結果。
Given the valuations, why are we hesitant to extend duration? Policy risk. Tariffs, immigration policy changes, and tax cuts could all add to inflationary pressures down the road. It is too early to know what the choices will be, but we expect the markets to be wary until there is more clarity.
The rising risks are showing up in the "term premium"—the extra yield that investors demand to hold longer-term Treasuries as compared to a series of short-term Treasuries. It can be thought of as the market's price of uncertainty. The term premium for 10-year Treasuries has moved up from negative 25 basis points last fall to nearly 50 basis points as of Jan. 2, 2025. It reflects the market's concerns about the potential for a shift in the outlook.
The 10-year Treasury term premium has risen to nearly 50 basis points

資料來源:Bloomberg。
Adrian Crump & Moench 10 年期國債定期溢價 (ACMTP10 指數)。截至 2021 年 12 月 13 日的每日數據。
期限溢價是投資者為承擔短期國債收益率沒有按預期發展的風險所需的補償。上圖中的期限溢價是根據紐約聯邦儲備銀行經濟學家 Tobias Adrian、Richard K. Crump 和 Emanuel Moench 開發的統計模型得出的(Tobias、Crump 和 Moench,「使用線性回歸定價,」期刊,2013 年 10 月)。過往表現不保證未來結果。僅用於說明目的。
The move up of 75 basis points is providing investors with more compensation now than a few months ago, but we are concerned that it could move higher. In the period leading up to and directly after the financial crisis, it averaged between 100 and 200 basis points. We doubt another major move up is likely, as most of the worries about inflation are largely reflected in the recent rise in yields, but with policy uncertainty high, we remain cautious.
How wide a range?
Assuming that the Fed cuts the federal funds rate by 50 basis points this year to an upper bound of 4% and inflation edges lower, we estimate that the upper end of the range for 10-year Treasury yields would be about 5%. Barring any major policy surprises, we would view that as an opportunity for fixed income investors to add to the duration in their portfolios. For now, we prefer to be somewhat more cautious about duration and look for opportunities in the months ahead.